H1
The True Cost of a Branded Hi-Vis Vest Program: A Procurement Math Guide
Intro
When a procurement manager asks “how much does a hi-vis vest cost,” the answer that gets shopped around is a single per-unit number — usually with no context for class, material, decoration, quantity, or replacement frequency. That number is almost always wrong for the actual program cost. A fleet of 800 construction workers spending six dollars per vest sounds cheap until you remember they each wear out three vests a year and you’re underspending on the screen-print durability that determines whether the logo is still legible at month nine. This guide walks through real procurement math at common quantity tiers, the variables that move per-vest cost, and the program-level numbers that matter for budget planning.
The five cost variables, ranked by impact
In rough order of cost impact per unit:
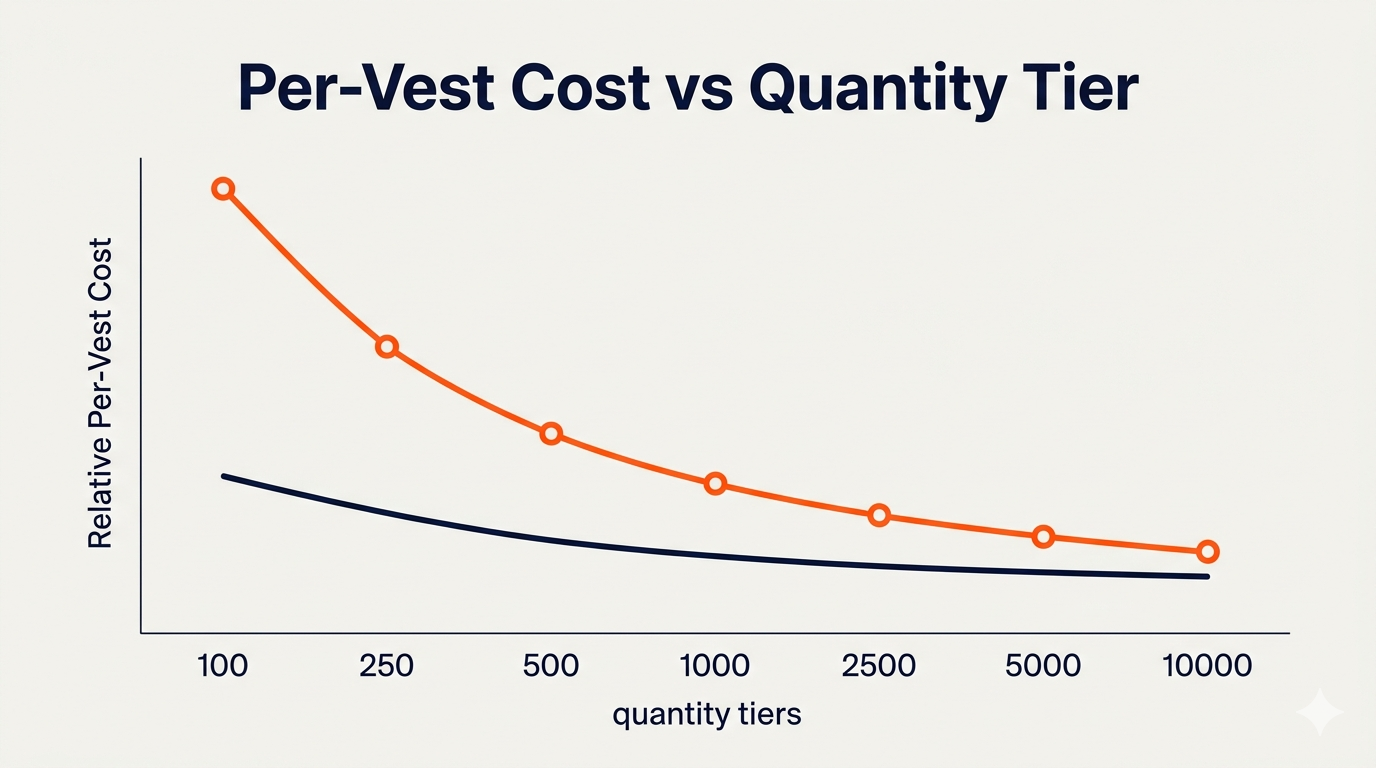
- Quantity. Volume discounts at 100, 250, 500, 1,000, 2,500, 5,000, and 10,000+ tier breaks. The cost-per-vest drop from 100 to 1,000 units is often 25–35%. From 1,000 to 10,000, another 15–20%.
- ANSI 107 class. Class 3 runs 15–25% more per vest than Class 2 at the same quantity tier.
- Material chemistry. FR modacrylic runs 60–100% more per vest than standard polyester at the same quantity. Mesh vs tricot is a 6–12% delta in either direction.
- Decoration complexity. Single-color screen print on one location vs four-color heat transfer on three locations is a 25–40% per-vest cost delta.
- Customization complexity. Mixed-color runs, per-role back panels, name embroidery, and per-sub variants all add modest per-unit cost (3–8%) but significant setup time.
Rush surcharge (25% of order total for 10–14 day production) is a sixth variable that applies asymmetrically.
Per-vest cost ranges by tier (illustrative)
These are relative figures for a representative Class 2 polyester vest with a single-color screen-print chest logo and a single-color heat-transfer back panel — a typical “ANSI 107 compliant branded vest” spec.
| Quantity | Approximate per-vest cost | Setup cost (amortized) | Total program cost |
|---|---|---|---|
| 100 | High end of range | Significant per-unit | Pilot order |
| 250 | -15% from 100 tier | Lower per-unit | Small fleet |
| 500 | -25% from 100 tier | Modest per-unit | Mid-size fleet |
| 1,000 | -35% from 100 tier | Minimal per-unit | Annual program tier 1 |
| 2,500 | -45% from 100 tier | Negligible per-unit | Multi-site program |
| 5,000 | -50% from 100 tier | Negligible | Enterprise annual |
| 10,000+ | -55% from 100 tier | Negligible | National contract |
The volume curve flattens significantly after 2,500. Most of the structural cost reduction is captured by the time you reach 1,000 units. Quantities above 10,000 trigger direct-manufacturing pricing where the curve flattens further but no longer drops as dramatically.
Class 3 premium
The same vest spec, upgraded to Class 3:
- 60% more fluorescent background material (1240 sq in vs 775 sq in)
- ~55% more retroreflective tape (310 sq in vs 201 sq in)
- Sleeve construction with reflective tape (added labor)
Net effect: 15–25% per-vest premium at the same quantity tier. At higher volumes, the premium compresses toward 15% because tape and material acquisition costs amortize better. At low volumes (under 100), the premium can hit 30%.
FR modacrylic premium
Same vest spec, upgraded to FR modacrylic blend:
- 80–120% more expensive base fabric per square yard
- FR-compatible thread, FR-compatible decoration materials
- Additional QC documentation per order (ASTM F1506 certification, ATPV verification)
Net effect: 60–100% per-vest premium at the same quantity tier. The premium is structural — the modacrylic blend itself is fundamentally more expensive than polyester — and compresses less with volume than the Class 3 premium.
Replacement cycle math
A per-vest cost is meaningless without the replacement cycle. Typical service lives for branded hi-vis vests by use case:
| Use case | Service life | Annual replacement % |
|---|---|---|
| Indoor warehouse, mesh, daily wash | 8–12 months | 100–150% per year |
| Indoor warehouse, tricot, weekly wash | 12–18 months | 67–100% per year |
| Construction, tricot, outdoor | 10–14 months | 86–120% per year |
| Road and highway, tricot Class 3 | 8–12 months | 100–150% per year |
| Utility distribution, FR tricot | 18–30 months | 40–67% per year |
| Event marshaling, mesh, occasional use | 3–5 events | Variable |
| Security, tricot, outdoor | 12–18 months | 67–100% per year |
For a 500-vest construction fleet on a 12-month replacement cycle, the program-level annual cost is 500 vests + ~500 replacement vests = 1,000 vests per year. Procurement planning that budgets one vest per worker per year understates the cost by 50–100% for active outdoor use cases.
A worked example: 1,000-vest construction fleet
A general contractor with 1,000 workers across multiple regional sites, wanting branded Class 2 tricot vests with chest logo and back-panel sub-name customization.
Initial deployment (Year 1):
- 1,000 vests at the 1,000-unit tier per-vest cost
- One-time artwork setup (amortized in per-vest price)
- Shipping freight to regional warehouses
- Estimated total: per-vest cost × 1,000 + shipping
Replacement (Year 1, mid-year and end-of-year):
- 400–500 replacement vests (50% of fleet at 12-month cycle, but worn-out replacement is rolling)
- Reorder pricing from approved artwork (no setup)
- Estimated total: per-vest cost × 450 + shipping
Year 2 forward:
- 800–1,000 replacement vests per year
- Reorder pricing
- Quarterly draws against an annual master PO smooths cash flow
A program that scoped only the initial 1,000-vest order missed roughly 80–100% of the actual annual cost. Most procurement managers learn this the hard way in month 9 of Year 1.
The hidden costs (and savings)
Reorder lead time. Approved-artwork reorders ship in 2 weeks. New-artwork orders ship in 4 weeks. For programs with predictable hiring or wear, locking artwork on file saves 2 weeks of expedited shipping or rush surcharge across the year.
Mixed-size runs. Mixed-size runs (S–5XL) at no upcharge save the cost of separate orders per size. Some vendors charge per-size setup; the right ones don’t.
Per-role variants. Different vest colors or back panels by role (associate vs team lead vs supervisor) can be produced under one PO with no setup penalty if requested at order time. Splitting orders by role across multiple POs doubles the setup time and ships separately.
Net 30 terms. For procurement organizations with cash-flow planning, Net 30 on 250+ vest orders is meaningful. Verified business accounts can request it after the first order.
Annual master PO. Locking annual pricing against a master PO with quarterly draws gives you cost predictability and a faster fulfillment SLA. Most enterprise customers use this structure after Year 1.
CPM math for activation programs
For sponsorship and brand-activation use cases (event-staff vests funded by a beverage sponsor, race-marshal vests funded by a tourism agency), the math shifts to cost-per-thousand-impressions (CPM).
A branded marshal vest at a 50,000-person event with full back-panel sponsor placement generates:
- ~500 marshals × 50,000 attendees × ~20% attendee-marshal direct sight contact = ~5,000,000 impressions
- Sponsor cost: ~$15,000–$30,000 for 500 vests
- CPM: $3–$6
Compared to other on-premise activation spend (printed signage, branded glassware, table tents), branded vests sit in the bottom quartile of CPM and have the highest engagement angle (vests are worn by humans who interact with attendees).
For sponsor-fulfillment use cases, the per-vest cost is the wrong frame. CPM and impressions-per-dollar are the right frame, and hi-vis vests perform well by that measure.
The procurement decision
Build a 12-month program cost model, not a per-order cost model. The variables to lock down before quoting:
- Total workforce or staff count → initial deployment quantity
- Use case (indoor warehouse, construction, road, FR utility, event, security) → material and class
- Replacement cycle for that use case → annual replenishment volume
- Decoration complexity → setup amortization
- Whether the program supports multi-role or multi-region variants → PO structure
A vendor quoting a single per-vest number without these inputs is quoting the wrong question. A vendor walking you through the 12-month program model is doing the work that saves you 30–50% on actual program cost.
Bottom line
Quantity, class, material, and decoration drive 80% of per-vest cost. Replacement cycles drive program-level cost — and most procurement budgets undercount that by half. For fleet hi-vis programs, model the 12-month total, lock artwork on file, structure annual master POs with quarterly draws, and pay attention to the decoration durability that determines whether the brand is still legible at month nine.
CTA: Send us your fleet size, use case, and replacement cycle assumptions. We’ll model your 12-month program cost and quote at your tier. → /get-a-custom-quote
Win Free Stuff
Enter below for a chance to win plus receive 10% off your first order.
🎉 You are in!
Check your email for your 10% off code. Good luck!